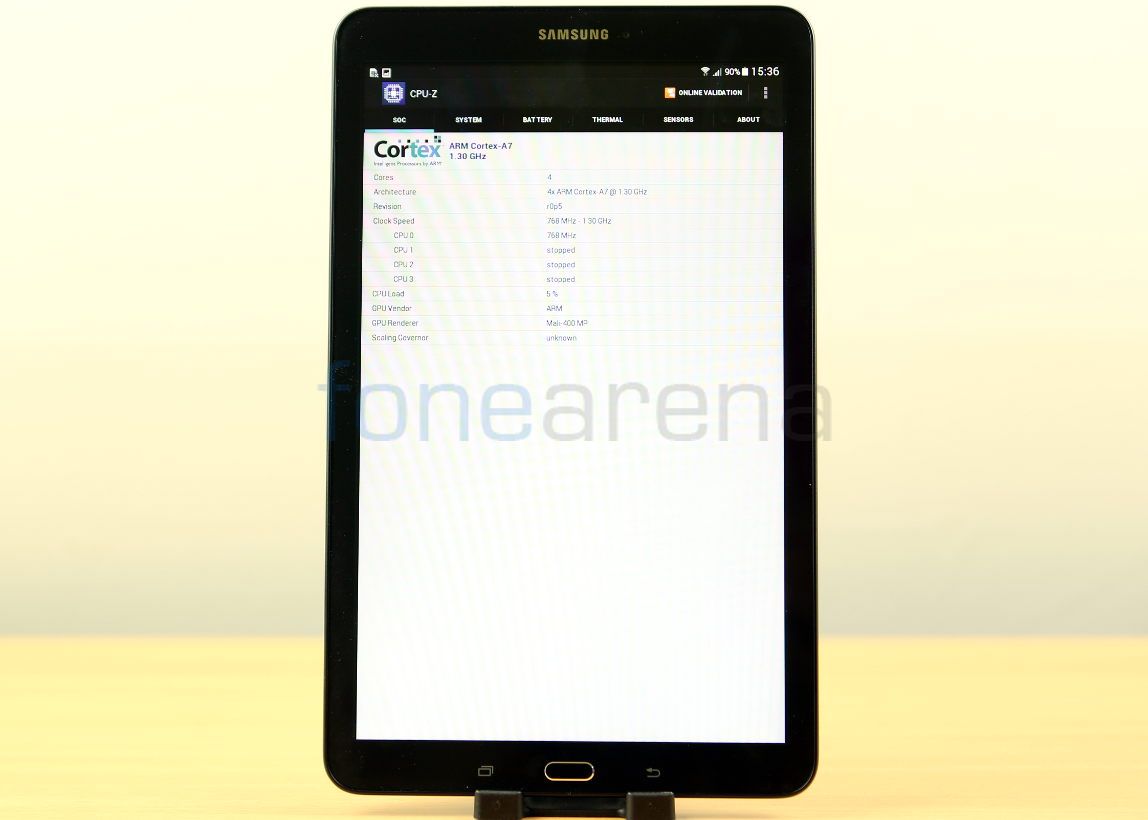
Samsung launched the Galaxy Tab E (SM-T561) in India last month at a price tag of Rs. 16,900. We brought you the unboxing of the tablet recently, here we have the benchmarks. It powered by a quad-core Spreadtrum (SC7730) SoC that has four ARM Cortex-A7 CPUs clocked at 1.3 GHz per core and Mali-400 GPU. It has 1.5GB RAM, 9.6-inch (1280 x 800 pixels) WXGA TFT 16:10 display and runs on Android 4.4 (KitKat) with Samsung’s own UI on top. Let’s check out how the tablet performs in a range of synthetic benchmark tests.
httpv://www.youtube.com/watch?v=qiHjmreRcO4
Quadrant Benchmark
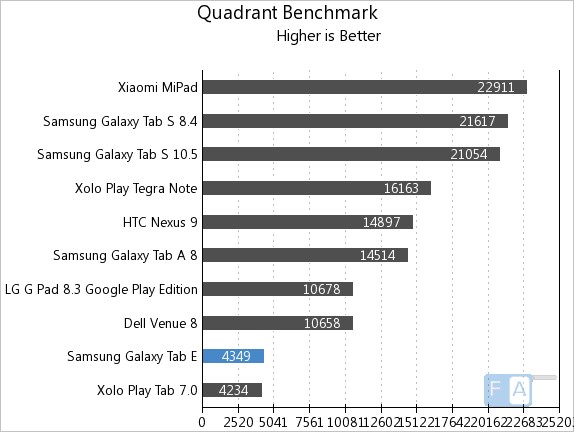
It managed to score 4349 points in the Quadrant Benchmark.
AnTuTu Benchmark 5
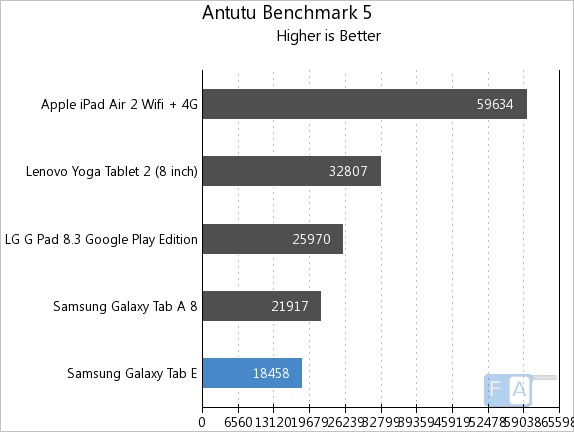
It managed to score 18458 points in the AnTuTu Benchmark 5.
Vellamo 2.0 HTML5
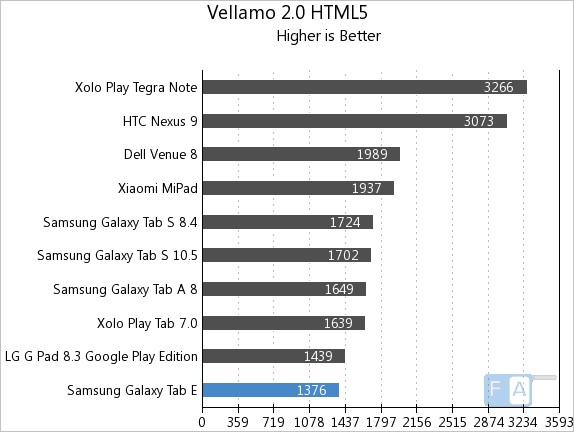
It managed to score 1376 points in the Vellamo 2 HTML5 browser benchmark.
Vellamo 2.0 Metal
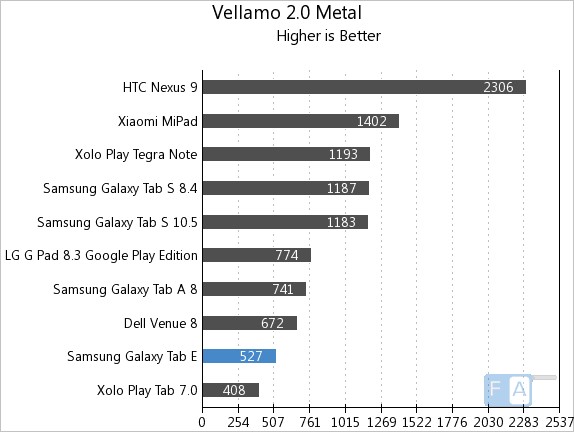
It managed to score 527 points in the Vellamo 2 Metal CPU subsystem performance test.
Linpack Single Thread
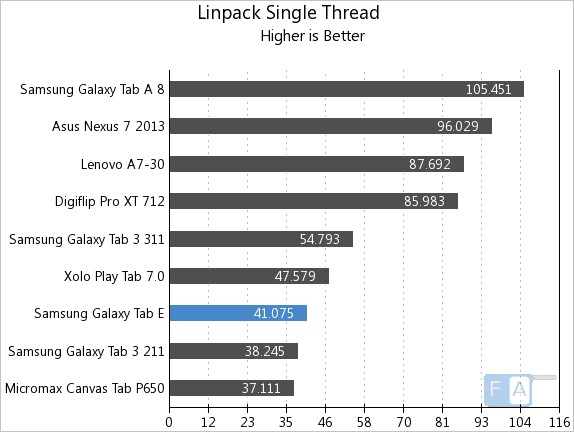
It managed to clock around 41.07 points in the Linpack Single Thread benchmark.
Linpack Multi-Thread
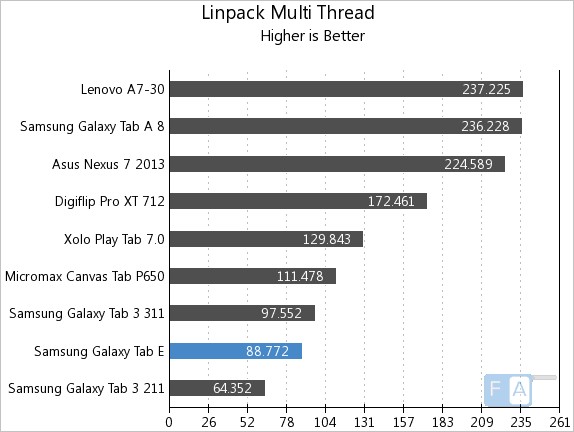
It managed to clock around 88.77 points in the Linpack Multi-Thread benchmark.
Geekbench 3 Single-Core
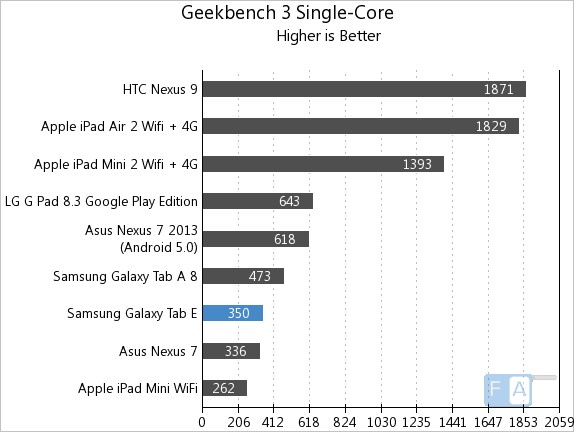
It scored 350 points in the Geekbench 3 Single-Core benchmark.
Geekbench 3 Multi-Core
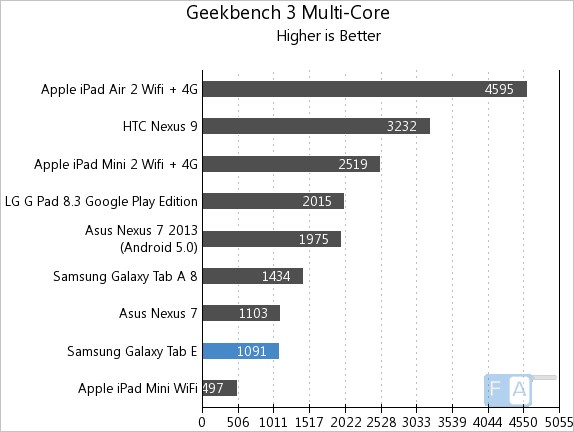
It scored 1091 points in Geekbench 3 Multi-Core benchmark.
NenaMark 2
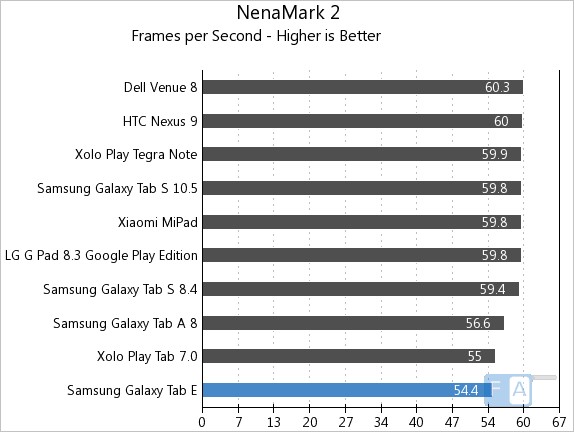
It clocked 54.4 fps in the NenaMark 2 benchmark.
GFXBench 2.7 T-Rex (On screen)
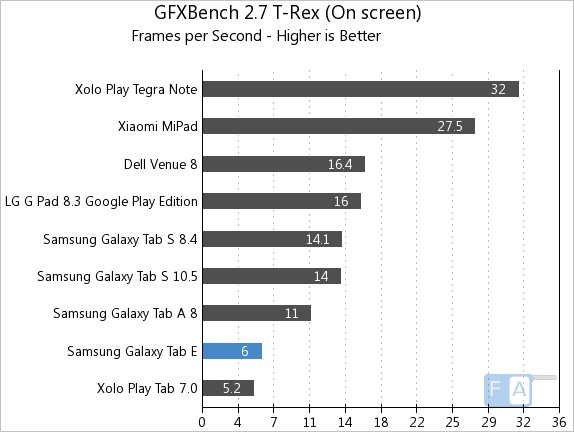
It clocked around 5.2 fps in the GFXBench 2.7 T-Rex benchmark.
3DMark Ice Storm Unlimited
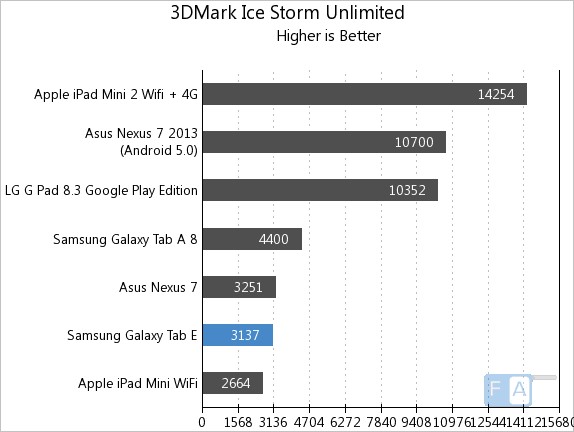
It managed to score 3137 points in 3DMark Ice Storm Unlimited GPU benchmark.
Basemark X 1.0 HD (Onscreen)
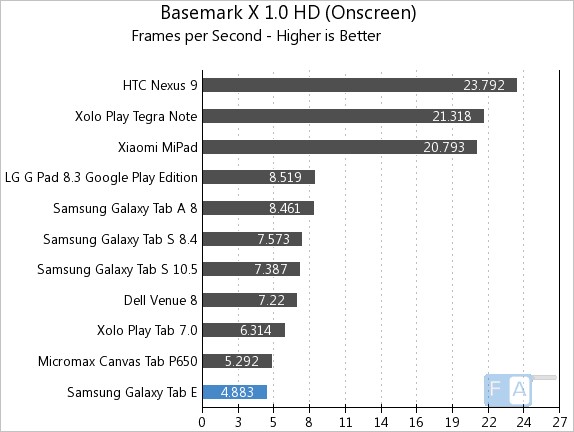
It managed to clock around 4.88 fps in Basemark X 1.0 HD OnScreen benchmark.
Basemark X 1.0 HD (Offscreen)
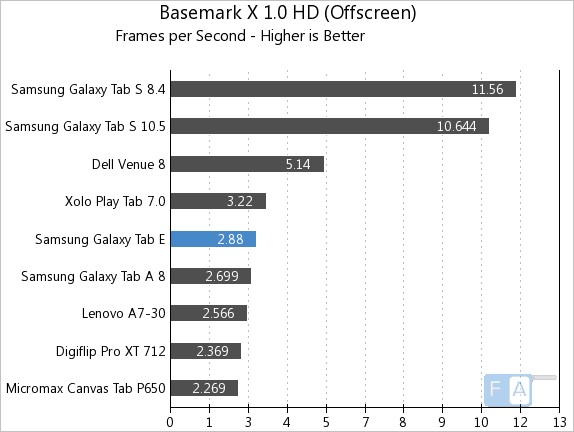
It clocked around 2.88 fps in Basemark X 1.0 HD OffScreen benchmark.
Basemark OS II
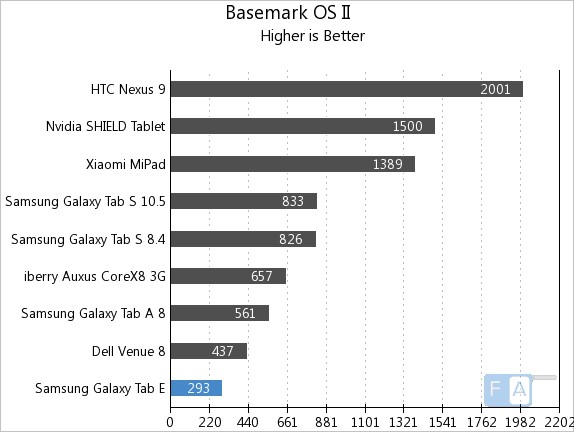
It scored 293 points in Basemark OS II GPU benchmark. These are just synthetic benchmark scores. We will let you know about the real life performance in the complete review soon.
