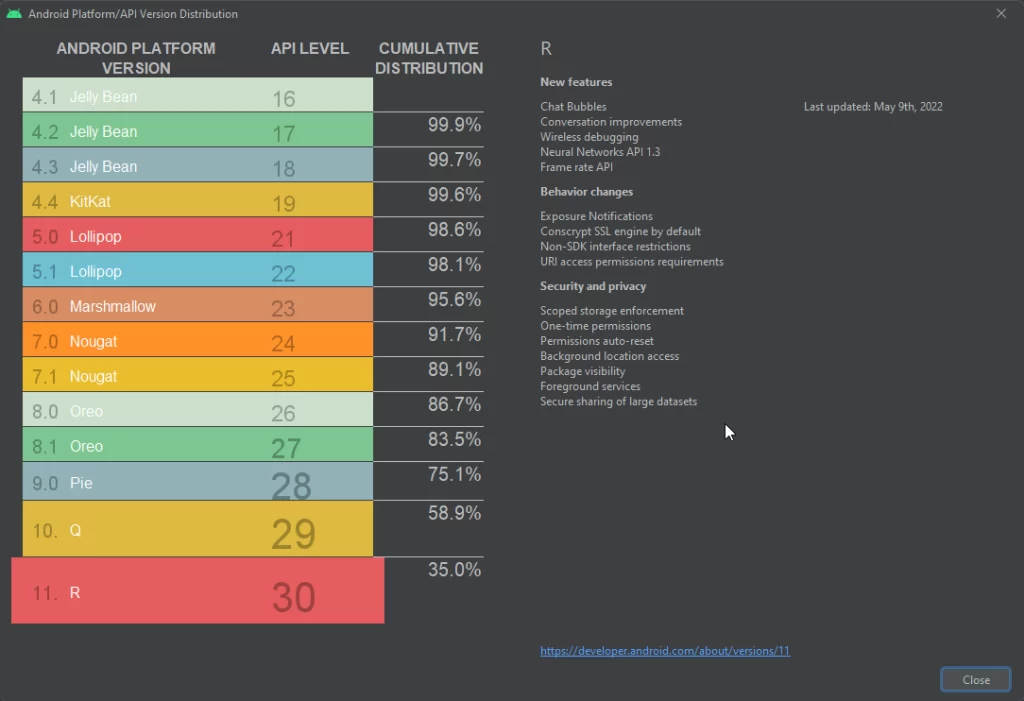
Google has updated its Android distribution chart, importing the data into Android Studio rather than displaying the percentage of devices running a specific version of the OS or higher on their website. The graphic is meant to help developers decide which Android version to support. The Android Studio chart is now updated every six months to a year, with the most recent version released in November and a new one on May 9.

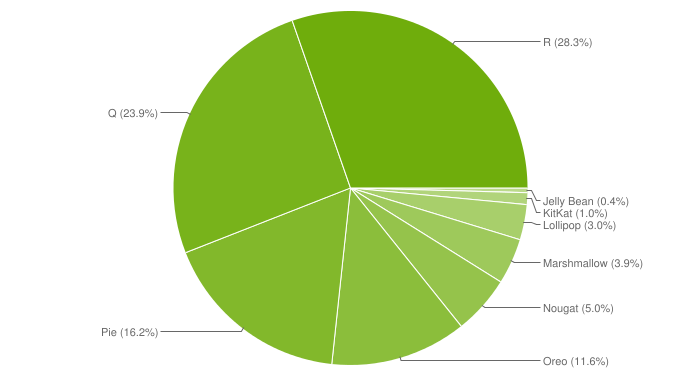
In the latest update to the chart, Android 11 currently has a platform-leading share of 28.3%, an increase of 4% from November 2021. In the meantime, Android 10’s market share has dropped to 23.9% from 26.5%, and older versions of Android are also seeing decreased usage.

It is evident from the chart that Android 11 (API level 30) or higher is currently required for new apps and app upgrades, but the minimum supported version is entirely up to the developers. The omission of Android 12 on this list could be due to the chart’s aim rather than a lack of adoption.
It was once uncommon for the most recent version to be the most popular, but thanks to Android OEMs like Samsung, things have greatly improved in recent years. However, Android lags far behind in terms of adopting the most recent version of the operating system.
